
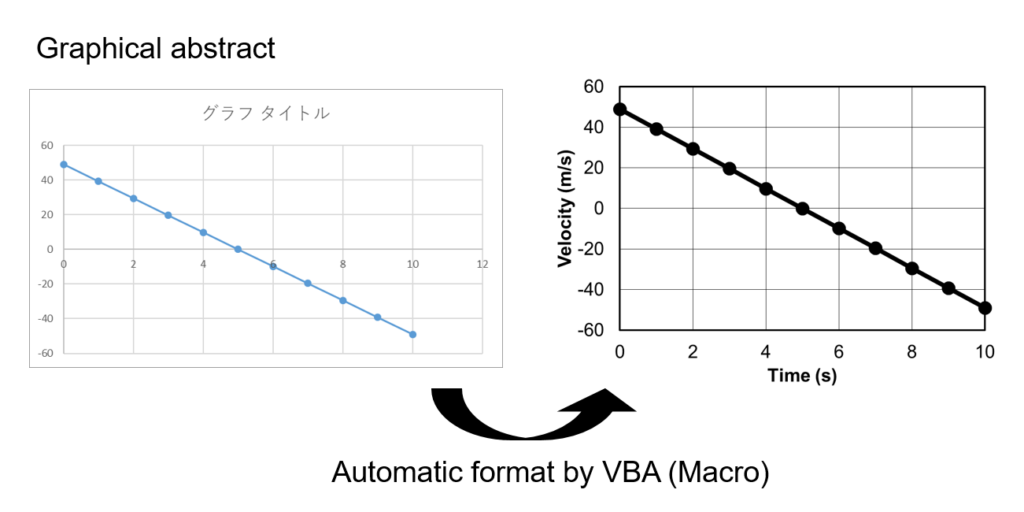
本記事では、Excelで作製したグラフをレポート・論文用に整えるためのVBAコードを紹介します。
MS (MicroSoft) Excelで作成したグラフの見た目をレポート、論文用に整える手順を以下の記事で紹介しました。

ここでは、上記の記事で紹介した手順を自動実行するためのVBA(Visual Basic for Application)コードを紹介します。紹介するVBAコードを活用すると簡便にグラフの見た目を調整することが可能になります。
以下でVBAを利用する上で、必要な最低限の設定方法と作業方法を紹介しています。VBAに触れたことが無い方は適宜ご確認ください。

VBAコードと使い方
VBAコード
Sub Set_Graph_Style()
    ' グラフの見栄えを設定

    ' グラフを代入する変数を宣言
    Dim graph As Chart

    ' 現在選択しているグラフを代入
    Set graph = ActiveChart


    With graph

        ' グラフタイトルを非表示
        .HasTitle = False


        ' 軸ラベルの表示 y軸、x軸
        .Axes(xlValue).HasTitle = True
        .Axes(xlCategory).HasTitle = True

    End With


    '軸ラベルの設定
    Call Set_AxisTitle(graph)


    ' 軸の見た目を調整(目盛ラベル)
    Call Set_TickLblFnt(graph)


    ' 軸の交点と目盛りを設定
    Call Set_AxisTick(graph)


    ' 枠線と目盛線の設定
    ' 枠線の設定
    Call Set_Frame(graph)
    ' 目盛り線の設定
    Call Set_Gridlines(graph)


    'プロット線とマーカーの設定
    Call Set_PlotLineMarker(graph)

    With graph

        ' 外枠の消去
        .ChartArea.Border.LineStyle = 0


        ' グラフ領域のサイズ設定
        .ChartArea.Width = 500
        .ChartArea.Height = 350

    End With

End Sub

Function Set_AxisTitle(graph As Chart)
    ' 軸ラベルの設定

    With graph
        ' y軸のラベル設定
        With .Axes(xlValue).AxisTitle

            ' 軸ラベル
            .Text = "Velocity (m/s)"

            ' フォント、サイズ、色
            .Font.Name = "Arial"
            .Font.Size = 20
            .Font.Color = RGB(0, 0, 0)
        End With

        ' x軸のラベル設定
        With .Axes(xlCategory).AxisTitle

            ' 軸ラベル
            .Text = "Time (s)"

            ' フォント、サイズ、色
            .Font.Name = "Arial"
            .Font.Size = 20
            .Font.Color = RGB(0, 0, 0)
        End With

    End With

End Function

Function Set_TickLblFnt(graph As Chart)
    ' 軸の見た目を調整(目盛ラベル)

    ' y軸の設定
    With graph.Axes(xlValue).TickLabels.Font

        '目盛ラベルのフォント、サイズ、色
        .Name = "Arial"
        .Size = 20
        .Color = RGB(0, 0, 0)
    End With

    ' x軸の設定
    With graph.Axes(xlCategory).TickLabels.Font

        '目盛ラベルのフォント、サイズ、色
        .Name = "Arial"
        .Size = 20
        .Color = RGB(0, 0, 0)
    End With

End Function

Function Set_AxisTick(graph As Chart)
     ' 軸の交点と目盛りを設定

    ' y軸の設定
    With graph.Axes(xlValue)

        ' 最小値、最大値の設定
        .MinimumScale = -60
        .MaximumScale = 60

        ' 主目盛り
        .MajorUnit = 20
        ' 補助目盛
        .MinorUnit = 5

        'x 軸との交差位置を設定(xlMinimum:最小値)
        .Crosses = xlMinimum

    End With

    ' x軸の設定
    With graph.Axes(xlCategory)

        ' 最小値、最大値の設定
        .MinimumScale = 0
        .MaximumScale = 10

        ' 主目盛り
        .MajorUnit = 2
        ' 補助目盛
        .MinorUnit = 1

        'x 軸との交差位置を設定(xlMinimum:最小値)
        .Crosses = xlMinimum

    End With

End Function

Function Set_Frame(graph As Chart)
    ' 枠線の設定


    With graph.Axes(xlValue).Format.Line
        ' 線の色、太さ
        .ForeColor.RGB = RGB(0, 0, 0)
        .Weight = 2
    End With
    With graph.Axes(xlCategory).Format.Line
        ' 線の色、太さ
        .ForeColor.RGB = RGB(0, 0, 0)
        .Weight = 2
    End With
    With graph.PlotArea.Format.Line
        ' 線の色、太さ
        .ForeColor.RGB = RGB(0, 0, 0)
        .Weight = 2
    End With


End Function

Function Set_Gridlines(graph As Chart)
    ' 目盛り線の設定

    With graph.Axes(xlValue).MajorGridlines.Border
        ' 目盛線の色、太さ
        .Color = RGB(0, 0, 0)
        .Weight = 1
    End With
    With graph.Axes(xlCategory).MajorGridlines.Border
        ' 目盛線の色、太さ
        .Color = RGB(0, 0, 0)
        .Weight = 1
    End With

End Function

Function Set_PlotLineMarker(graph As Chart)
    'プロット線とマーカーの設定
    Dim obj As Object

    Set obj = graph.FullSeriesCollection
    With graph.SeriesCollection.Item(1)
        ' 線の太さ、色
        .Border.Color = RGB(0, 0, 0)
        .Format.Line.Weight = 5

        ' マーカーのサイズ、形状、色
        .MarkerSize = 10
        .MarkerStyle = xlMarkerStyleCircle
        .MarkerBackgroundColor = RGB(0, 0, 0)
        .MarkerForegroundColor = RGB(0, 0, 0)
    End With

End Function
使い方
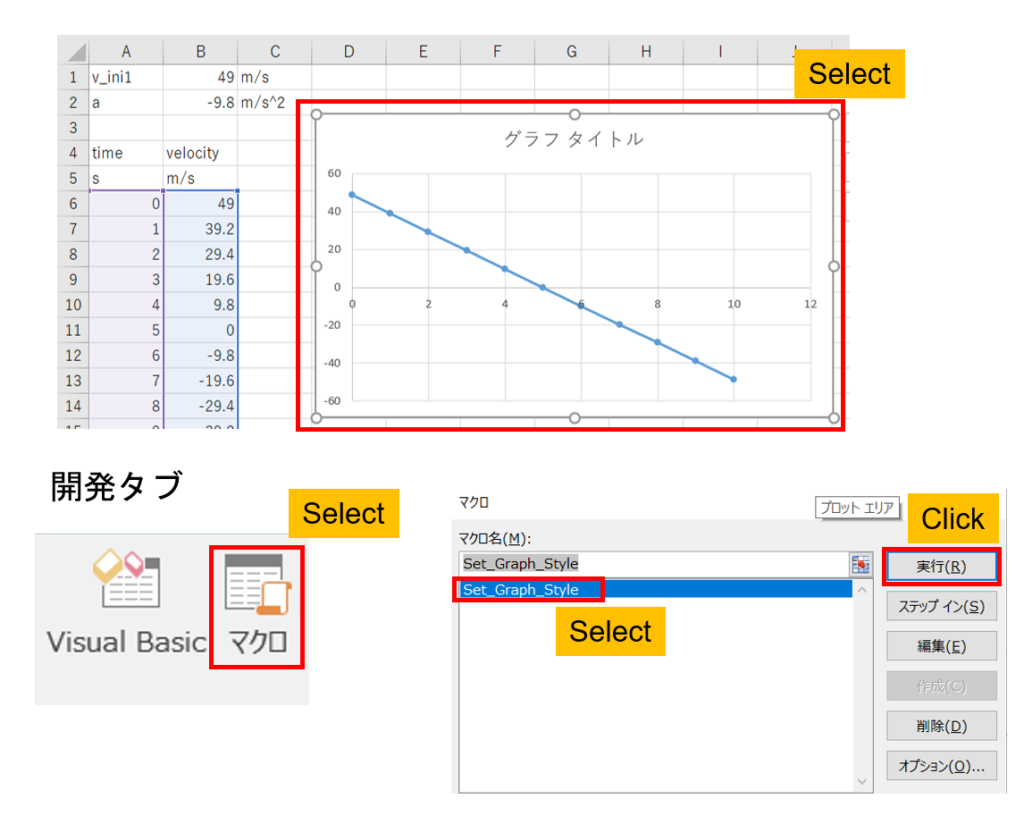
上記のコードは選択中のグラフに対して作用します。グラフの選択を忘れて実行するとエラーが発生するので注意してください。
- 「開発」タブの「Visual Basic」を開いてください。
- 「標準モジュール」内のいずれかのモジュール(module1など)に上記のコードを張り付けてください。
- Excel内で見た目を調整するグラフをクリックして選択された状態にしてください。
- 「開発」タブをの「マクロ」を選択してください。
- 「マクロ」ダイアログで”Set_Graph_Style”を選択し、「実行」を押してください。
- 図の体裁が変更されるので確認してください。
グラフタイトルの消去・軸ラベルの追加
グラフタイトルの消去と軸ラベルの表示は、Sub ”Set_Graph_Style()”内の以下の箇所で行っています。
With graph

    ' グラフタイトルを非表示
    .HasTitle = False


    ' 軸ラベルの表示 y軸、x軸
    .Axes(xlValue).HasTitle = True
    .Axes(xlCategory).HasTitle = True

End With
軸ラベルの設定
軸ラベルの「ラベル名」、「フォント」、「フォントサイズ」、「フォント色」の設定は以下のFunction ”Set_AxisTitle()”にて行っています。
Function Set_AxisTitle(graph As Chart)
    ' 軸ラベルの設定

    With graph
        ' y軸のラベル設定
        With .Axes(xlValue).AxisTitle

            ' 軸ラベル
            .Text = "Velocity (m/s)"

            ' フォント、サイズ、色
            .Font.Name = "Arial"
            .Font.Size = 20
            .Font.Color = RGB(0, 0, 0)
        End With

        ' x軸のラベル設定
        With .Axes(xlCategory).AxisTitle

            ' 軸ラベル
            .Text = "Time (s)"

            ' フォント、サイズ、色
            .Font.Name = "Arial"
            .Font.Size = 20
            .Font.Color = RGB(0, 0, 0)
        End With

    End With

End Function
軸の見た目を調整
軸目盛の「フォント」、「フォントサイズ」、「フォント色」の設定は以下のFunction ”Set_TickLblFnt()”にて行っています。
Function Set_TickLblFnt(graph As Chart)
    ' 軸の見た目を調整(目盛ラベル)

    ' y軸の設定
    With graph.Axes(xlValue).TickLabels.Font

        '目盛ラベルのフォント、サイズ、色
        .Name = "Arial"
        .Size = 20
        .Color = RGB(0, 0, 0)
    End With

    ' x軸の設定
    With graph.Axes(xlCategory).TickLabels.Font

        '目盛ラベルのフォント、サイズ、色
        .Name = "Arial"
        .Size = 20
        .Color = RGB(0, 0, 0)
    End With

End Function
軸の交点と目盛を設定
目盛の最大・最小値、目盛間隔、横軸と縦軸の交点の設定は、以下のFunction ”Set_AxisTick()”にて行っています。
Function Set_AxisTick(graph As Chart)
     ' 軸の交点と目盛りを設定

    ' y軸の設定
    With graph.Axes(xlValue)

        ' 最小値、最大値の設定
        .MinimumScale = -60
        .MaximumScale = 60

        ' 主目盛り
        .MajorUnit = 20
        ' 補助目盛
        .MinorUnit = 5

        'x 軸との交差位置を設定(xlMinimum:最小値)
        .Crosses = xlMinimum

    End With

    ' x軸の設定
    With graph.Axes(xlCategory)

        ' 最小値、最大値の設定
        .MinimumScale = 0
        .MaximumScale = 10

        ' 主目盛り
        .MajorUnit = 2
        ' 補助目盛
        .MinorUnit = 1

        'x 軸との交差位置を設定(xlMinimum:最小値)
        .Crosses = xlMinimum

    End With

End Function
枠線と目盛り線の設定
グラフの枠線と目盛線の設定は、それぞれ以下のFunction ”Set_Frame()”、Function ”Set_Gridlines()”にて行っています。
Function Set_Frame(graph As Chart)
    ' 枠線の設定


    With graph.Axes(xlValue).Format.Line
        ' 線の色、太さ
        .ForeColor.RGB = RGB(0, 0, 0)
        .Weight = 2
    End With
    With graph.Axes(xlCategory).Format.Line
        ' 線の色、太さ
        .ForeColor.RGB = RGB(0, 0, 0)
        .Weight = 2
    End With
    With graph.PlotArea.Format.Line
        ' 線の色、太さ
        .ForeColor.RGB = RGB(0, 0, 0)
        .Weight = 2
    End With


End Function
Function Set_Gridlines(graph As Chart)
' 目盛り線の設定
With graph.Axes(xlValue).MajorGridlines.Border
' 目盛線の色、太さ
.Color = RGB(0, 0, 0)
.Weight = 1
End With
With graph.Axes(xlCategory).MajorGridlines.Border
' 目盛線の色、太さ
.Color = RGB(0, 0, 0)
.Weight = 1
End With
End Functionマーカーとプロット線の設定
プロット線とマーカーの設定は、以下のFunction ”Set_PlotLineMarker()”にて行っています。
このコードはプロットデータが1つの場合のコードです。複数のデータをプロットする場合は、”Item(1)”の部分を”Item(2)” ,”Item(3)”,・・・としてそれぞれのプロットに対して設定を行ってください。
Function Set_PlotLineMarker(graph As Chart)
    'プロット線とマーカーの設定
    Dim obj As Object

    Set obj = graph.FullSeriesCollection
    With graph.SeriesCollection.Item(1)
        ' 線の太さ、色
        .Border.Color = RGB(0, 0, 0)
        .Format.Line.Weight = 5

        ' マーカーのサイズ、形状、色
        .MarkerSize = 10
        .MarkerStyle = xlMarkerStyleCircle
        .MarkerBackgroundColor = RGB(0, 0, 0)
        .MarkerForegroundColor = RGB(0, 0, 0)
    End With

End Function
外枠の消去
外枠の消去は、Sub ”Set_Graph_Style()”内の以下の箇所で行っています。
このコードでは合わせてグラフのサイズ調整も行っています。
With graph

    ' 外枠の消去
    .ChartArea.Border.LineStyle = 0


    ' グラフ領域のサイズ設定
    .ChartArea.Width = 500
    .ChartArea.Height = 350

End With